The top marketplace metrics to track [2024]
It takes time to build a marketplace that generates enough revenue for you & your team to go full time.
It takes even longer for your marketplace to start generating the profit that you need to grow.
So how do you know if your marketplace is doing well? What are the key metrics that you need to track in order to convince yourself & investors that you’re moving in the right direction? And what are the key performance indicators (KPIs) that will give you an early warning signal that your business is going downhill, so that you can correct things before they go wrong?
In this article I will give you a comprehensive list of what marketplace metrics you can track & what software solutions you can use to help you track these metrics. This will include:
Note —
You do not need to track all of these metrics before finding product-market fit. Eric Riess, creator of the Lean Startup methodology explains that prior to finding product-market fit the goal is to validate that you’ve built something that people want. At this stage the data you collect should be focused on measuring the macro effect of an experiment. At this stage data should be easy to understand & tied to real people.
Marketplace metrics about size
Metrics about size give you an idea of how large your marketplace is. The three most important marketplace metrics for size are Gross Merchandise Volume (GMV), Take Rate & Contribution Margin I. Let’s take a closer look at how to calculate each of these marketplace metrics & how best to track them.
Gross Merchandise Volume (GMV)
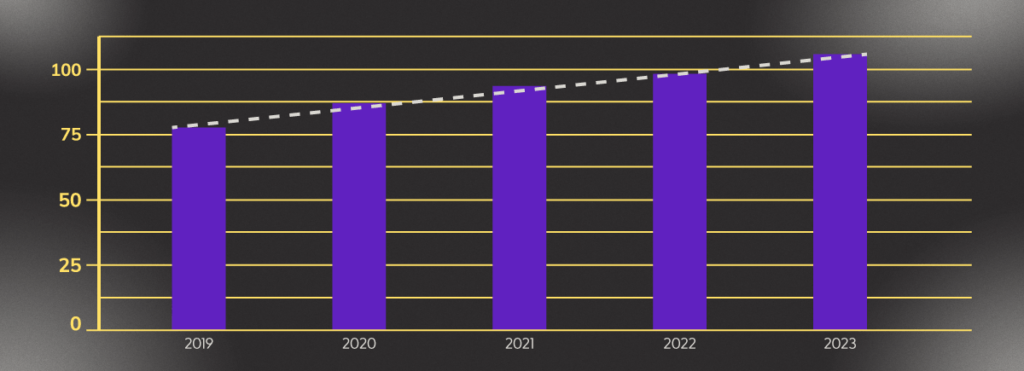
The Gross Merchandise Volume or GMV is the total value of goods & services exchanged on your marketplace over a set period of time e.g. a month. The GMV metric shows the rough size of your marketplace & how this has grown over time.
To calculate the GMV simply add up the total value of all of the transactions that take place on your platform. For example, let’s say that you have two transactions that happen on your marketplace where someone buys a product or service with a value of $100 & another person buys a product or service for $200. In this instance, the GMV is $300.
If you track the GMV over time, you will see how the marketplace is growing.
Although the GMV is a good metric to work out the total size of the marketplace it does not give us a clear indication of the health of the marketplace. To work this out you need to look at the take rate.
The take rate (%)
The take rate is the percentage of GMV that your marketplace makes in revenue i.e. the transaction fee. The take rate is typically seen as a proxy of the total value of the marketplace. This is because the higher the take rate often indicates that the marketplace is delivering more value to the buyers & sellers on the platform i.e the take rate suggests that buyers & sellers are happy to pay more to the marketplace for the essential services of connecting buyers with the right products or services, facilitating secure transactions & ensuring efficient delivery.
A low take rate is considered better in certain circumstances:
- When the marketplace is focused on growth the platform operators may decide to keep the take rate low in order to attract & retain users. This can be useful when the marketplace is looking to attract early adopters or to attract more buyers & sellers when onboarding new categories of products.
- A low take rate can be a strategy advantage in a highly competitive market. Offering a low take rate can attract more sellers & buyers compared to rival platforms.
- Some marketplaces aim to make revenue through high transaction volume rather than high fees. In this case the marketplace may decide to keep the take rate low to encourage more frequent & larger transactions, which can result in more frequent & larger transactions.
- In certain cases marketplaces may establish strategic long term partnerships with key sellers or suppliers. Offering a low take rate can be a way to maintain these strategic relationships.
Contribution Margin
The contribution margin, often referred to as the “contribution margin ratio” or “contribution,” is a marketplace metric to understand how much profit the marketplace makes from each transaction after covering the variable costs associated with making the sale.
You can think of Contribution Margin as a “slice of profit” that you get from each sale. For example, if someone buys a product from a seller on your marketplace, the contribution margin considers not only the fees or commission you earn from the seller but also any costs associated with attracting & serving the buyer. Similarly, if a seller successfully completes a transaction, the contribution margin takes into account the costs related to acquiring & retaining that seller.
Having a positive contribution margin means that, on average, each transaction contributes more revenue than the costs associated with both sides of the marketplace, indicating a sustainable & profitable business model. It’s a crucial metric for assessing the overall health and profitability of your two-sided marketplace.
Marketplace metrics about shape
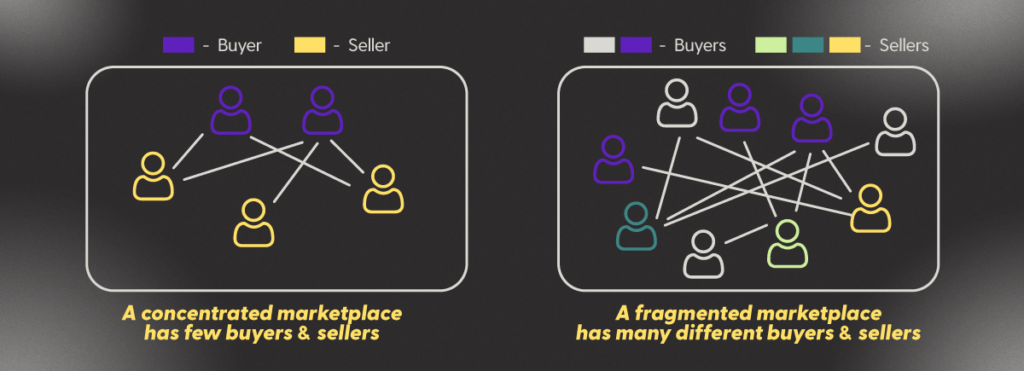
Marketplace metrics about shape give you an idea of how fragmented or concentrated the marketplace is.
A fragmented marketplace is characterized by a large number of small independent sellers or providers, each with a relatively small market share. Think Uber – where there are a large number of drivers, Airbnb – where there are a large number of property owners or Etsy – where there are a large number of artisans. In a fragmented marketplace there is a lot of choice, a lot of competition, relatively low barriers to entry & so on.
In contrast, a concentrated market is one where there are relatively few sellers or providers & these sellers & providers hold a large market share. Think about the marketplace for online advertising, computer operating systems, social media platforms & so on.
It is important to know how fragmented or concentrated your marketplace is, as it will inform strategic decision making. Most marketplaces start off as highly concentrated whereas more mature marketplaces tend to perform better in highly fragmented markets where competition is high & there is no dependency on a small number of players.
The marketplace metrics that are used to measure the concentration of your marketplace include: number of active buyers & sellers, the top X active buyers & sellers as a percentage of GMV & the percentage of monogamous transactions.
Number of active buyers & sellers
The number of active buyers & sellers acts as a high level view of marketplace fragmentation or concentration. A large number of active buyers & sellers indicates that your marketplace is more fragmented, whereas a low number indicates that your marketplace is more concentrated.
Remember, it is important to consider the number of active buyers & sellers relative to the maturity of your marketplace. Don’t beat yourself up for having a low number of buyers & sellers in the first few years. It takes time to build up the marketplace.
The top X active buyers & sellers as a percentage of GMV
To get a more accurate view of marketplace fragmentation, you need to look at the top X number of active buyers & sellers relative to the size of your marketplace. For instance, if you have 100 active buyers & sellers, but 1 seller accounts for 99% of the Gross Merchandise Volume (GMV) on your marketplace, then it is clear that your marketplace is dependent on a single seller.
Percentage of monogamous transactions
This marketplace metrics tells you the extent of “monogamy” on your platform. It is calculated as the percentage of all transactions that are repeat orders between the same buyer & seller.
Healthy marketplaces should exhibit low numbers of monogamous transactions, otherwise there is an increased risk of disintermediation i.e. the buyers & sellers move off your platform. Some categories of marketplace are naturally more monogamous than others e.g. childcare. This means that these marketplaces will exhibit higher than average rates of monogamy. Nevertheless, it is important to monitor the percentage of monogamous transactions as this will give you a clear picture of the health of your marketplace.
Marketplace metrics about liquidity
Liquidity is the lifeblood of any marketplace. It measures the speed & efficiency with which the marketplace matches buyers & sellers on the platform. It is often said that liquidity IS the marketplace since, without any liquidity there are no transactions taking place & therefore there is no marketplace.
The concept of liquidity is really easy to understand however, measuring liquidity can be much harder. In this section we will look at three key marketplace metrics that give some insight into marketplace liquidity: number of transactions, match rate & time taken to match.
Number of transactions
The number of transactions or “matches” between buyers & sellers for a given period of time (day, week, month) is a high level indicator of how well your marketplace is doing. More matches mean that your marketplace is doing more of what it was built to do – matching buyers & sellers. Therefore, the more matches, the more healthy your marketplace is.
Match rate (%)
The match rate tells you how many matches take place as a percentage of the total listings, over a given period of time. To understand why this tells you about the liquidity of your marketplace, you can think about the match rate like hotel occupancy. If a hotel has a large number of rooms, but the match rate on any given day is low, this means that there are not many people staying in the hotel each day. Similarly, what percentage of Airbnb’s properties are being occupied each day? What percentage of Uber’s drivers are being hired out each hour?
A high match rate is a signal of a healthy marketplace, a low match rate is a signal of an unhealthy marketplace.
Time taken to match
Another way to measure the liquidity of a marketplace is the number of hours, days, weeks or months that a listing stays inactive before being matched. For Airbnb, how long is a property unoccupied? In the case of Uber, how long does it take for a drive to find a job? In the case of Etsy, how long does a product remain unsold.
A low time taken to match is indicative of a healthy marketplace however, this should be considered relative to the type of product or service that is being sold. For instance, a driver waiting two days for a 10 minute job to come will probably think that the platform doesn’t work whereas a property owner with a spare room to book will be happy to wait more than 2 days for a match to take place.
Marketplace metrics about acquisition
Customer acquisition happens differently for B2B vs B2C marketplaces. Therefore, there are different marketplace metrics that you need to consider for B2B vs B2C.
B2B marketplace metrics about acquisition
In a B2B marketplace, acquiring new customers is all about how effectively you can move them through your sales funnel. The marketplace metrics here include:
- Number of qualified leads generated for a given period of time. Leads are considered qualified if they answer positively to a set of qualification questions. Qualification questions will be unique to each business.
- Percentage of inbound vs outbound leads. The more inbound leads the better. To generate inbound leads, create valuable & relevant content, optimize your website for search engines, engage with your target audience through social media & run paid search campaigns.
- Conversion rate of the leads at each stage of the sales funnel. Your sales funnel will be custom to your marketplace however, B2B sales funnels normally consist of a qualification, first call, product demo & closing call. The conversation rate tells you how efficient you are at converting the sales funnel.
- Length of sales cycle. How efficiently can you move a qualified prospect through your sales funnel? This is the length of the sales cycle.
- First time buyers (FTBs) evolution. This refers to trends that you observe in the characteristics of your first time buyers or sellers.
- Customer Acquisition Cost (CAC) is the total sales & marketing costs for a given period of time divided by the total number of new users for that same period. It tells you what is the marginal cost of acquiring a new user onto your marketplace.
B2B marketplace metrics about acquisition
- Percentage of website traffic that is organic vs paid. Organic website traffic is non-paid. It is typically focused on producing content that is optimized for search engines. The two largest search engines on the internet are Google & Youtube. Paid traffic is generated primarily by ads, for example, Google Ads, Facebook / Instagram Ads & so on.
- Cost per acquisition (CPA) by channel. Marketing costs for users acquired via a particular channel. You should measure each channel & know what is the most effective channel for your business. This will allow you to put the maximum focus on the most effective channels.
- Conversion rate percentage. The conversion rate is calculated as a percentage of users that land on a particular page of your website & then convert into paying customers. For instance, let’s say that 100 users land on a page on your website & 10 of those users convert to paying customers, this means that your conversion rate is 10%.
- Customer Acquisition Cost (CAC) is, as explained above, the total sales & marketing costs for a given period of time divided by the total number of new users for that same period. It tells you what is the marginal cost of acquiring a new user onto your marketplace.
Note —
Measuring marketplace metrics around acquisition can be done with tools such as CRM solutions, Google Analytics, Google Data Studio & Funnelytics. These tools allow you to create real-time dashboards that help you capture the above information & to analyze the effectiveness of your different marketing channels.
Marketplace metrics about retention and engagement
Marketplace metrics that focus on retention & engagement tell you how much users rely on your marketplace. Retention tells you how many of your users return to your marketplace & engagement tells you how many of your users engage on the platform.
Ideally you want all of your users to return very often so that your platform becomes the de facto place for transactions that involve your product or service to take place. When you first start your marketplace it will be mainly new users however, as your marketplace matures, you want to see that there is a healthy balance between new users & retained users.
Remember, it is always easier to get a repeat purchase from an existing client that is happy, than it is to find a new client.
The top three marketplace metrics that we recommend you use to monitor for retention & engagement are (1) percentage of users that return by cohort, (2) the number of repeat transactions & (3) share of wallet.
Percentage of users that return by cohort (retention)
The percentage of returning users is the proportion of users who come back to transact on your platform at a point in their lifetime. This should be measured by “cohorts”. Cohorts are groups of users who signed up for your marketplace in the same week, month, quarter or year. For example, you might look at the percentage of returning users that signed up in Q1 2024 vs the percentage of returning users that signed up in Q2 2024. This enables you to see how different user groups behave across different timelines. You can then calculate a weighted average across all cohorts to get a holistic view of your marketplace. This approach is known as cohort analysis.
Number of repeat transactions (engagement)
A good way to measure customer engagement is by looking at the number of repeat transactions that individual users make in a given time. For example, does an individual user make transactions once every three, six, eight or twelve months. As above, you should take an average number of transactions made across a cohort & then take a weighted average across all cohorts to get a complete picture of your marketplace.
Share of wallet (%)
The share of wallet is the percentage of a supplier’s total revenue that is generated via your marketplace. For example, if the supplier makes $100,000 in revenue for the year & they generate $60,000 of revenue from your marketplace, this means that the share of wallet is 60%.
The “share of wallet” tells you how dependent suppliers are on your marketplace to generate revenue. It is of course not easy to know what the supplier’s total revenue size is. Therefore, it is good practice to define an industry average. You can get this from sources such as industry reports or by running customer surveys.
Marketplace metrics about unit economics
The most important marketplace metrics are about unit economics. They are also the hardest to measure, because they have so many different inputs. However, these metrics are critical because they will tell you, & also potential investors, about how well your business is performing. The most important unit economics to measure are: customer lifetime value (LTV), customer acquisition cost (CAC) payback, LTV/CAC ratio.
Customer Lifetime Value (LTV)
The customer LTV is the total amount of value that you can extract from a customer over their lifetime on the platform. LTV is calculated as shown below.
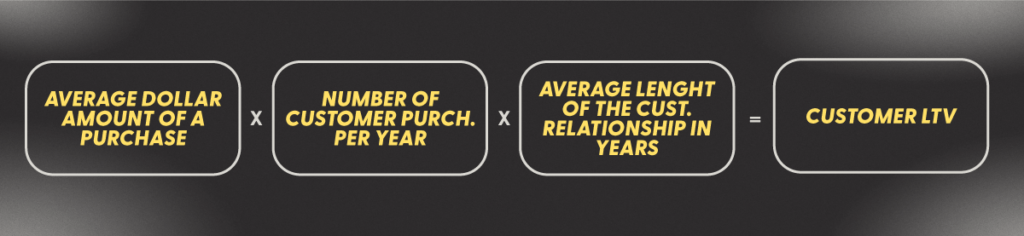
The hardest part of the calculation above is knowing the total number of transactions for a given period. Especially in the early days of your marketplace, you will likely not have this data. Therefore, the best way to do this is to use the average number of transactions taken from your cohort analysis & then extrapolate this out for a 12 month time period. This conservatively assumes that your users will churn after a year.
Customer Acquisition Code (CAC) payback
The Customer Acquisition Cost (CAC) payback is the number of transactions required to “pay back” the cost of acquiring the users. CAC payback is calculated as shown below:
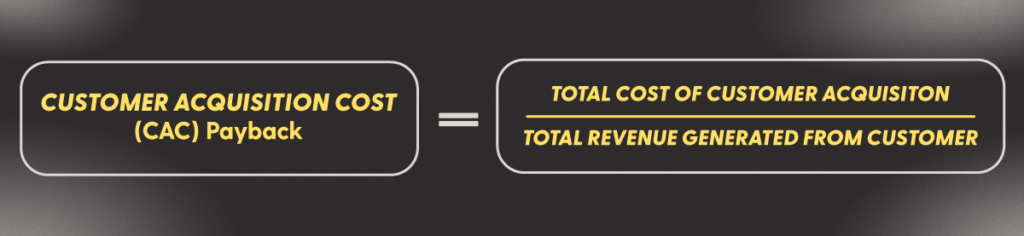
This is a very quick way to gauge your marketplace dynamics. For instance, if your vintage cars marketplace has a high Average Order Volume (AOV), but a low transaction frequency, then you need to set your take rate high enough so that you cover the CAC on the first transaction. This is because there is a very low likelihood of the transaction happening a second time.
LTV/CAC ratio
The LTV/CAC ratio measures the return on investment (ROI) per user in your marketplace. This is a critical metric that is used to assess the health of your business. As a general rule, LTV should be at least 3x greater than the CAC.
Final thoughts
Building a successful marketplace takes time. In this article we covered several metrics that you should consider in order to make strategic decisions on where to focus your attention when building your two-sided marketplace.
There are various tools that you can integrate into your marketplace website & app that will help you monitor the marketplace metrics discussed in this article. Payment processing providers like Stripe will show you data such as customer retention metrics & business unit metrics such as Customer LTV. Furthermore, marketing tools such as Google Analytics can be connected to platforms like Google Data Studio where you can build dashboards to monitor CAC & the effectiveness of different acquisition channels.
If you want to build a two-sided marketplace, complete with monitoring for marketplace metrics, check out Dittofi’s marketplace templates or schedule a call with Dittofi’s app consultants.